
The theory of demographic transition is a theory that throws light on changes in birth rate and death rate and consequently on the growth rate of the population. This theory explains the transition of population from one period to another along with the stages of economic development of the developed countries. This theory has been developed on the basis of the economic development growth rate of the population in developed countries.
Theory of Demographic Transition
According to E.G Dolam, demographic transition refers to a population cycle that beings with a fall in the death rate continuing the population. It concludes with a fall in the death rate.
C.P. Blacker divided the population into five types as high stationary .demographic transition population growth will have to pass these different stages during the course of economic development. the four stages of demographic transition are given below.
STAGE-1: In STAGE-1 birth rate was high and the death rate was also High .this STAGE has been called the stage of zero population growth. people mostly live in rural areas. Agriculture was the main occupation of the people. agriculture was backward, level of income was low. this factor positively affects the increase in the birth rate was low due to the lack of adequate medical facilities, doctors, and medicines.
STAGE-2: In STAGE-2 death rate started declining but the birth rate remained constant at a high level. There was a change in the occupation of the people. agriculture productivities and industrial productivities are increased. The level of income and standard of living also increases. medical science was well developed. thus in this stage birth rate remained constant at a high level but the death rate declined. there were problems of population exploitation.
STAGE-3: The STAGE-3 death rate continued to decline and the birth rate also declined. The industrial and tertiary sectors were well developed. the level of income was very high. medical facilities are well developed. the growth rate of the population declines.
STAGE-4: The fourth stage is called the stationary population. the birth and death rates are both at a low level. they are again near balance .there is little growth in population at this stage.
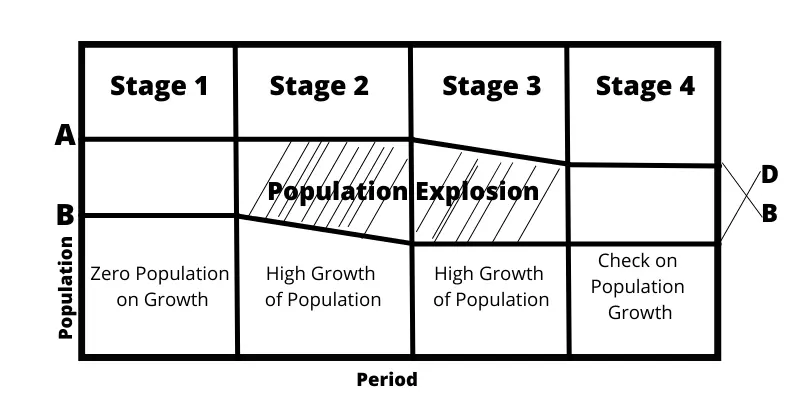
In the above diagram in stage 1 both the curve of birth rate B.B & curve of the death rate D.D. They are parallel to each other. It shows in the growth of the population stage. In stage 2 the B.B. curve remains a horizontal straight line but the B.B. curve slopes downward.
In stage 3 both these two curves slope downward but the D.D. curve remains a horizontal straight line. In stage 4 both two curve again move parallel to each other and remains in a horizontal straight line.